This figure shows the variation in cp with temperature for air.

Recall that in the constant specific heat assumption, we ignore this variation, and assume that a single value of cp is “good enough” over the full range of temperature. First, let’s look at the so-called “cold gas” approximation which just consists of using cp at a single temperature, regardless of the temperature range involved.

The figure below shows the percent error in Δh assuming that the specific heat is constant at its value at 300 K, and T1 is constant at 220K and the following definitions are used for Δh:


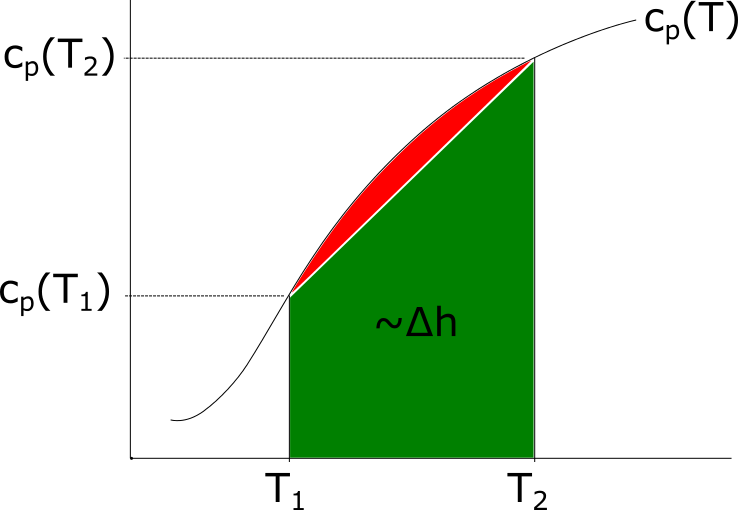
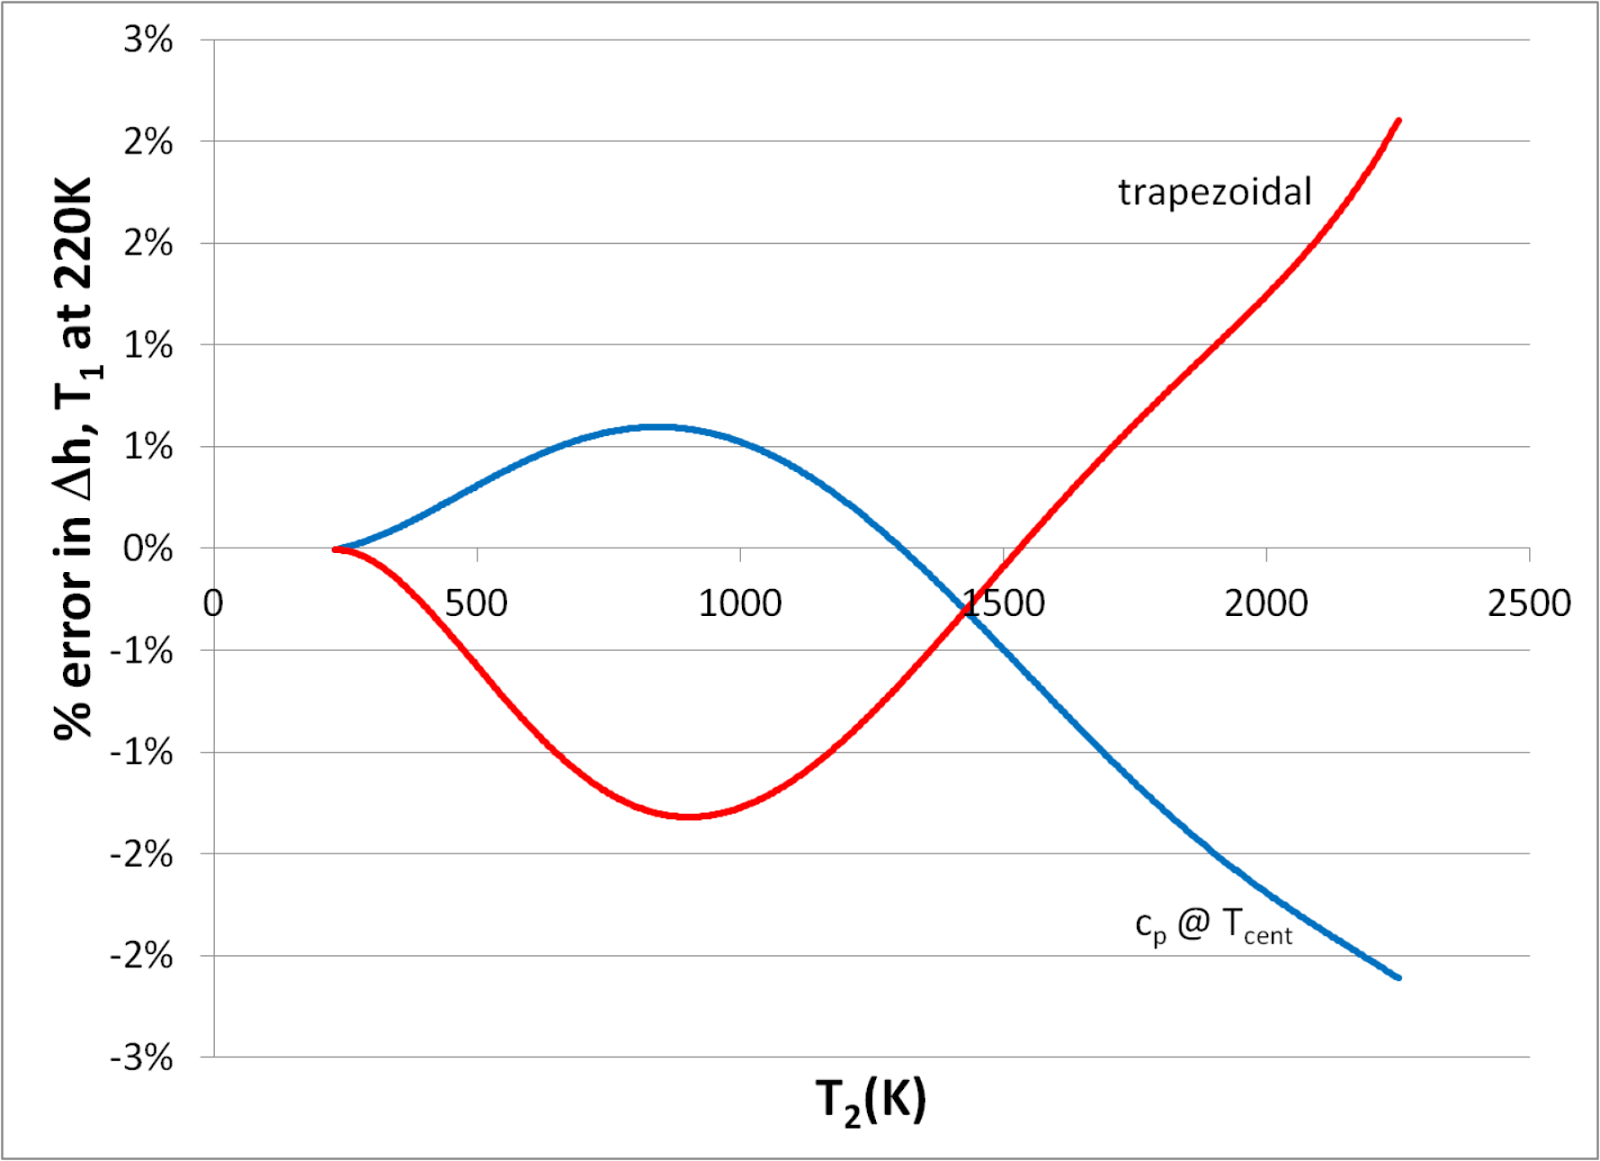
Now, let’s look at the error associated with using either the trapezoidal rule, or cp at the exact center of the temperature range, as shown here:

Finally, we will look at the error associated with smaller spans of temperature. In this figure, each colored line represents the error associated with a different temperature span: 100K, 200K, or 300K, plotted as a function of the center point of the span.
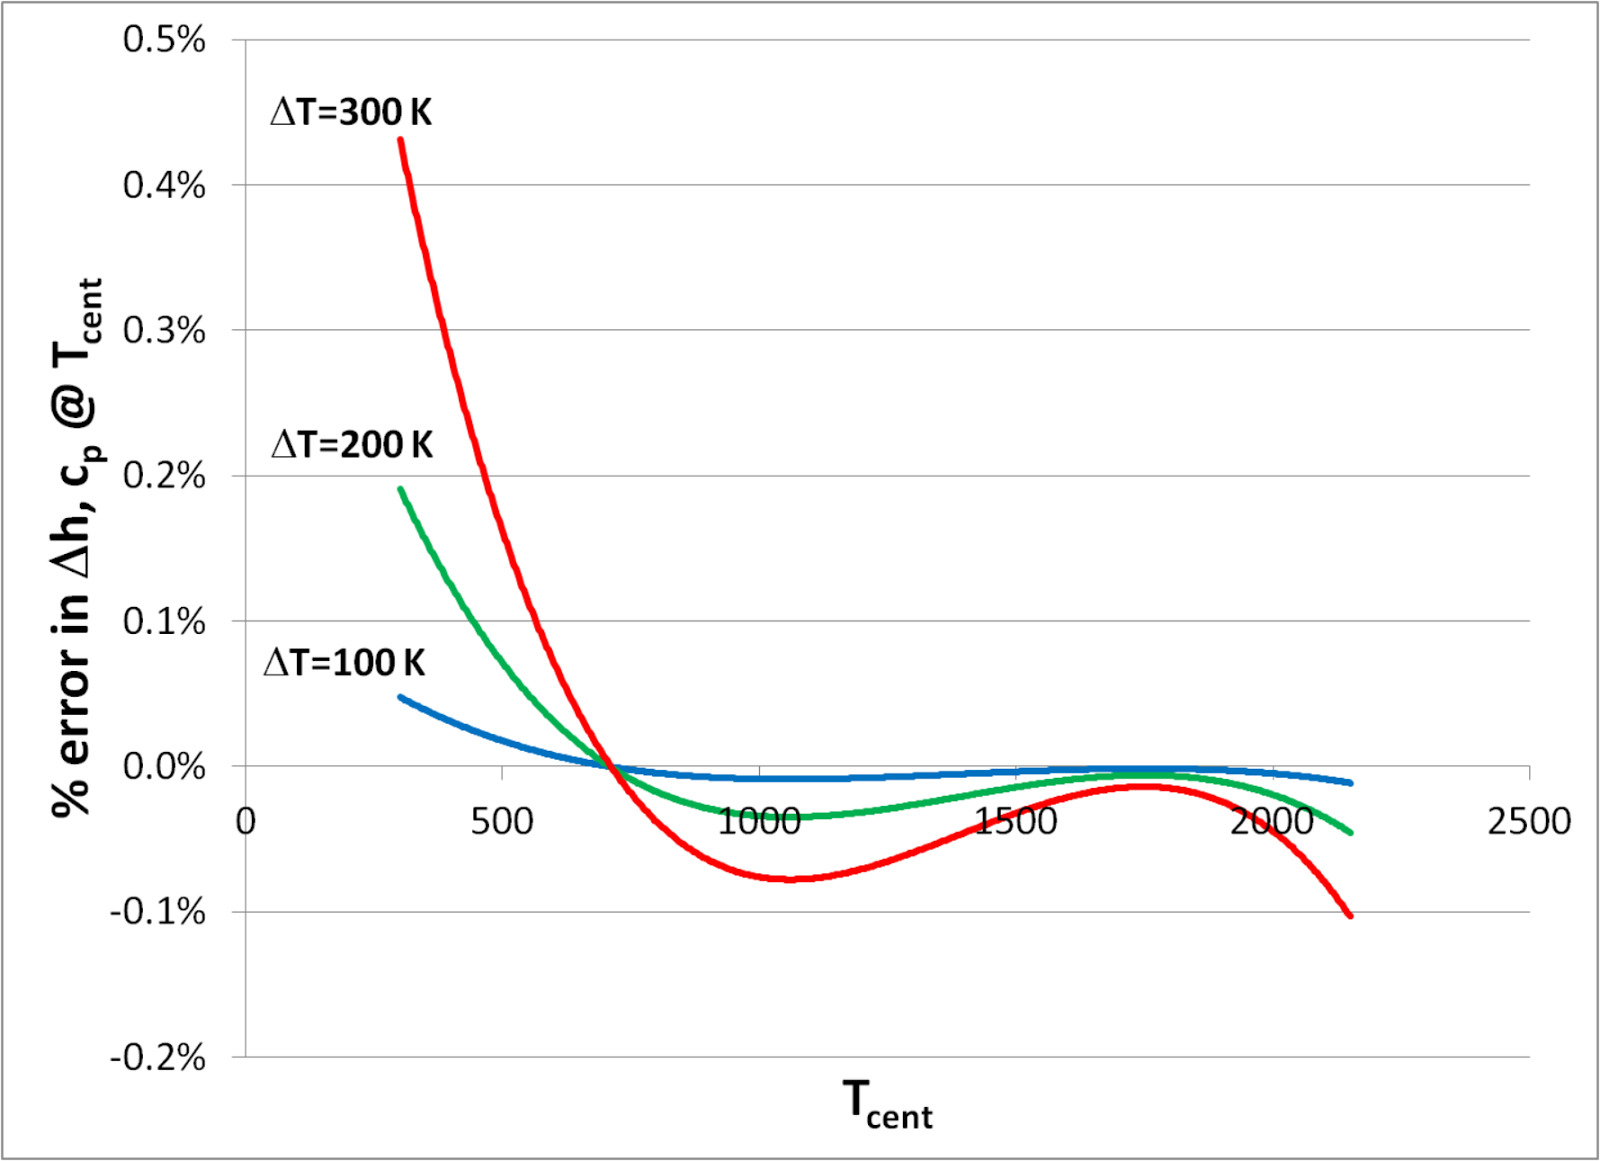
As might be expected, the error is very small for the smallest (100K) span, and somewhat higher for the others.
All of these results were only for air.
This figure shows cp for CO2. Notice that the range of cp is larger than for air.

These figures show the exact same error results for CO2 that were presented above for air.
Cold gas:


No comments:
Post a Comment