Monday, December 3, 2012

From the ground...down (part 2)


Last post we talked about the idea of a “penetration depth” to describe how deeply a fluctuating surface temperature might affect the temperature of the ground below.  

 Before we go on to talk more about the ground, we should point out that that kind of calculation isn’t limited to just temperature distribution in the ground.  It can be used to approximate the penetration depth of many situations where the surface temperature fluctuates periodically.  For example, if you wanted to estimate how deeply the temperature fluctuations penetrate into the wall of an engine cylinder, you might use properties for steel (α =17.7 mm^2/s) and the frequency of the periodic temperature variation of the cylinder (if the engine was running at 2000 rpm, you’d have 1000 temperature cycles per minute, or a frequency of 105 rad/s).  With those numbers, and using our definition of 2.2% fluctuation for the penetration from the last post, you could calculate a penetration depth of 2.2 mm. 

Thursday, November 1, 2012

From the ground...down


If you’ve ever lived in a house with a basement, or spent time in a cave, you are probably aware that the temperature underground remains fairly constant regardless of what the air temperature is doing.  Many times the basement is the warmest part of the house in the winter, and the coolest in the summer.  Old time root cellars took advantage of this uniform temperature before air conditioners and central heat were common. 
  
Obviously, fluctuations in the air temperature will penetrate some distance into the ground.  How deep will they go?  While this question is fascinating all by itself, it has some practical implications, too.

Tuesday, October 2, 2012

Thermal Explosions


While the term thermal explosion sounds very dramatic, it really just refers to a thermal event where the heat release (or absorption) occurs over a time period that is very small relative to the time scale of interest, and in a volume that is negligibly small compared to the surroundings in which the temperature distribution is to be calculated.  So, for example, the heat released by the combustion of  blasting powder in a small hole (time scale of milli-seconds) could be analyzed as a thermal explosion if the time scale of interest was on the order of seconds.  Also the decay heat generated by a pocket of radioactive rock (say, over 100 years) could be analyzed as a thermal explosion if the period of interest were, say, 10,000 years.

Wednesday, September 5, 2012

Hot (or Cold) to the Touch


At one time or another we’ve all experienced the sensation of feeling a different temperature depending on the material that we are touching.  Try it now—touch a nearby piece of metal with your fingertip, then, with another finger, touch a piece of wood or cloth.  Most likely the metal felt cooler to the touch than the wood did.  

How could this be if both objects have been sitting in the room long enough to come to thermal equilibrium with the surroundings? 

Wednesday, July 4, 2012

Approximate vs. Exact Solutions in Heat Transfer (part 2)


In the last post, we showed an approximate integral solution and an exact analytical solution to the same heat transfer problem: an isothermal semi-infinite solid subjected to a step change in temperature at the surface.

Exact solutions are very useful to have because they provide the true solution to the given problem.  Unfortunately, out of all possible problems, exact solutions tend to be relatively rare and also tend be limited to fairly simple situations, like this one.

Tuesday, June 12, 2012

Approximate vs. Exact Solutions in Heat Transfer

In analytical heat transfer, there are a variety of techniques to determine both exact and approximate solutions to problems.  To one way of thinking, all numerical solutions are approximate, since the exact differential equations have been discretized to enable an approximate solution via a system of algebraic equations.
Both exact and approximate solutions can be useful.  Let’s look at an example, then talk about some useful features of both types of solutions.

Tuesday, May 15, 2012

Liquid-piston dynamometers


A dynamometer is an important tool for studying liquid piston engines (or any kind of engine, for that matter) .  A dynamometer allows us to run the engine under varying external loads and also to measure the power produced by the engine.  All kinds of dynamometers have been developed over the years suited to many different engines and purposes.  While the testing of the solar-powered engine discussed in my last post provided the proof-of-concept, and yielded some useful operational information, the fact that the engine ran completely unloaded (only operating against internal friction) imposed a pretty severe limitation on the amount and usefulness of the information that could be learned.  Essentially, it would be like evaluating a car engine if the car were never taken out of neutral.  Actually, it is even more limiting than that because at least you could rev up a car engine whereas liquid piston engines operate in a resonance, and hence single speed, mode.

Thursday, April 26, 2012

A Solar-powered Fluidyne Test Bed

In our laboratory at the University of Colorado at Colorado Springs, we built and instrumented a solar-powered fluidyne (liquid piston heat engine) test bed. [1]

The test bed was intended to serve two purposes.  First, it was used to demonstrate direct solar-powered operation of a fluidyne with sunlight concentrated directly on the fluidyne cylinder rather than on a remote heat exchanger.  In addition, it was used to characterize some aspects of the operational thermodynamic cycle.  The test bed was only intended as a platform to explore feasibility and thermodynamic characteristics, not as a practical, power producing engine.  The test bed was to be powered by the sun using a 50” by 37” Fresnel  lens. The Fresnel lens supplied ample solar power for the fluidyne.  

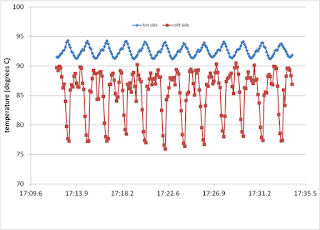
Measurements of temperature and pressure inside the working space of the engine showed that a temperature gradient existed across the working space at all times.  

This figure shows about 20 seconds of temperature data from a single test.  During this segment, the temperature fluctuations on the hot side were about 4 °C, and the temperature fluctuations on the cold side were approximately 12 °C.  As expected, the temperature fluctuations from the two thermocouples are out of phase with one another.  


This figure shows a pressure-volume plot of the working space.  The enclosed area represents the work of each cycle.  This engine was operated without any external load for this phase of testing.  Therefore, the indicated cycle work is only overcoming internal friction and other losses.   

The instrumented solar-powered fluidyne test bed demonstrated consistent and repeatable operation.  The Fresnel lens used provided ample energy to power the fluidyne.   Indicated work of the engine was collected with pressure and volume measurements.  Since the engine was unloaded, this work only overcame frictional losses.

[1]  J.W. Mason and J.W. Stevens, 2011, “Design and Construction of a of a Solar-powered Fluidyne Test Bed” Proceedings of the ASME 2011 Mechanical Engineering Conference and Exposition IMECE2011, November 11-17, 2011, Denver, Colorado, USA, paper IMECE2011-62194.


Wednesday, February 15, 2012

Liquid-piston Stirling Engines

       As I indicated in my last post, one bedeviling factor in many renewable energy applications is the difficulty of making a cost-effective conversion device because it is so hard to make enough money to offset relatively high capital costs. Naturally, improvements in conversion efficiency can help on the money-making side.  Another approach would be to try to pursue technologies where the capital cost (and typically, the efficiency) is low to begin with.  If the primary energy source has a low enough cost (zero, for example) the low efficiency is not as big a concern.  Note, however, that even with free energy and low capital equipment costs, there still remain many other costs such as land, maintenance, transport, etc.  Nevertheless, technologies with low costs for capital equipment are worth exploring [1,2] and may be viable for some niche applications.
       One such technology that may be promising is the liquid piston Stirling engine.  These heat engines can be built very cheaply from a few pieces of pipe and tubing.  While they tend to have very poor efficiency and power density, their very low capital cost could make them economical for some applications using free or low cost sources of heat.
Liquid piston Stirling engines use oscillating columns of liquid, typically but not necessarily, water, in place of the pistons of a traditional Stirling engine.  This figure shows one common configuration (of many possible) with water held in a U-shaped tube and in a connecting “tuning” line.  Oscillations of water in the U-tube shift the working fluid above the water (typically air) back and forth between the hot-side (heat input) and cold-side (heat rejection) of the engine.  Oscillations of the water in the tuning column alternately compress and expand the working fluid.  If the phasing is correct, the expansion occurs when the bulk of the working fluid is on the hot side, and the compression occurs when the bulk of the working fluid is cold, and the cycle produces net work.  The work can be extracted from the oscillations of the liquid in either column, from the pressure fluctuations of the working fluid, or in other ways.  In a properly designed system, the oscillations in both the U-tube and tuning column start moving spontaneously and with the proper phasing when heat input and extraction starts with the working fluid.  An animation at the end of the post illustrates the fluid motions.
         Liquid piston Stirling engines have had limited commercial success to power water pumps and have been proposed for electricity generation in a number of configurations.  West provides a comprehensive overview of the theory and operation of these devices [3,4]. Active research continues on a variety of aspects and applications e.g. [5-7].  Because they have relatively poor power density and efficiency, they would tend to function best for small-scale applications using free or low-cost heat sources such as commercial waste heat or concentrated solar energy.  Since the power output is proportional to the mean pressure of the working fluid as well as the working fluid volume and temperature difference, atmospheric engines using water for pistons have severe limitations on improvements of the power density.  Other configurations are, of course, possible.
On the positive side, liquid piston Stirling engines can be constructed with very low capital cost as indicated previously.  In addition, they are quite robust thermally and mechanically.  They are self-starting with the input of heat, and function well within very loose design and construction tolerances. 

 References
[1] J.W. Mason and J.W. Stevens, 2011, “Design and Construction of a  Solar-powered Fluidyne  Test Bed” Proceedings of the ASME 2011 Mechanical Engineering Conference and Exposition IMECE2011, paper IMECE2011-62194.
[2] J.W. Stevens, 2010, “Low Capital Cost Renewable Energy Conversion With Liquid Piston Stirling Engines,”  Proceedings of ASME 2010 4th International Conference on Energy Sustainability ES2010, paper ES2010-90129.
[3] West, C.D., 1983, Liquid Piston Stirling Engines, Van Nostrand Reinhold, N.Y.
[4] West, C.D., 1987, Stirling Engines and Irrigation Pumping, Oak Ridge National Laboratory Technical Report ORNL/TM-10475.
[5] Orda E. and Mahkamov, K., 2004, “Development of ‘Low-tech’ Solar Thermal Water Pumps for Use in Developing Countries,” J. Sol. Energy Eng. Vol. 126, pp. 768-774.
[6] Slavin, V.S., Bakos, G.C., Finnikov, K.A., 2009, “Conversion of thermal energy into electricity via a water pump operating in Stirling engine cycle”, Applied Energy, Vol. 86, pp. 1162-1169.
[7] Van de Ven, J.D., 2009, “Mobile hydraulic power supply: Liquid piston Stirling engine pump”, Renewable Energy, Vol. 34, pp. 2317-2322.


Friday, January 27, 2012

Capital Costs and Renewable Energy


Sometimes people think that because the primary energy is free, use of renewable energy sources should naturally grow to fill most or all of the energy needs of the world.  However, energy from renewable sources currently constitutes a relatively small fraction of total energy use in the United States and worldwide.  As one illustration, consider the electric power generation in the U.S by primary energy source in this figure from several years ago.  Excluding hydroelectric, only about 3% of the U.S. electric power came from renewable energy.  While progress is being made, and other perspectives would give somewhat different results, the main point is that renewable sources currently contribute very little to the overall energy needs of the world.

Why is this so?  Part of the answer lies with the relatively high capital costs associated with renewable primary energy sources.

While renewable energy sources such as wind and solar eliminate fuel costs, they have a low energy density relative to hydrocarbon fuels. Consequently, collection, transformation, and transport costs tend to be much higher per unit of energy than for traditional fuels, and the overall (capital, maintenance, fuel) cost of providing the renewable-sourced energy is often not economical.  While progress in efficiency and infrastructure continues to bring costs down, there is still a long way to go before renewable technologies replace hydrocarbon fuels on a large scale.  

As an illustration, this figure shows consumer prices for small photovoltaic panels as a function of size.  A rough estimate from this admittedly unscientific survey (I just looked up prices for solar panels on the internet) indicates that PV panels can be purchased for around $7000/kW. 

Now, the next figure shows an estimate for payback period as a function of capital cost, interest rate, and selling price of electricity with the assumption of no fuel cost and neglecting maintenance cost.  For a remotely reasonable payback period in the neighborhood of five years, the capital cost would have to be in the neighborhood of $1000-$3000 per kW.  Photovoltaic panels, at least at readily available consumer prices, correspond to an unreasonably long payback (around 18 years) for even the most optimistic assumptions on electricity prices and investment costs.

 So what is the conclusion?  Simple economics dictates that many renewable energy sources currently available are priced out of a competitive (unsubsidized) market by capital cost alone, despite any attractive attributes with regard to fuel costs.  Capital cost for renewable energy conversion technologies will be a primary element in their viability.